AI variance analysis: from numbers to a review-ready explanation
Work through a monthly finance review. Separate volume, product mix, realised price and unit costs, then challenge the explanation.
Revenue is below budget. Material cost per panel has increased. It is easy to turn those two observations into a convincing explanation. The harder question is whether the available evidence supports it.
This fictional power-panel manufacturer gives you a complete example to work through: a formula-driven Excel model, management notes, AI prompts and a worked review.
What changed in September?
Sales volume fell from 200 to 180 panels. The business also sold fewer custom panels and more motor control panels relative to the budget mix. Average realised prices and variable unit costs changed too.
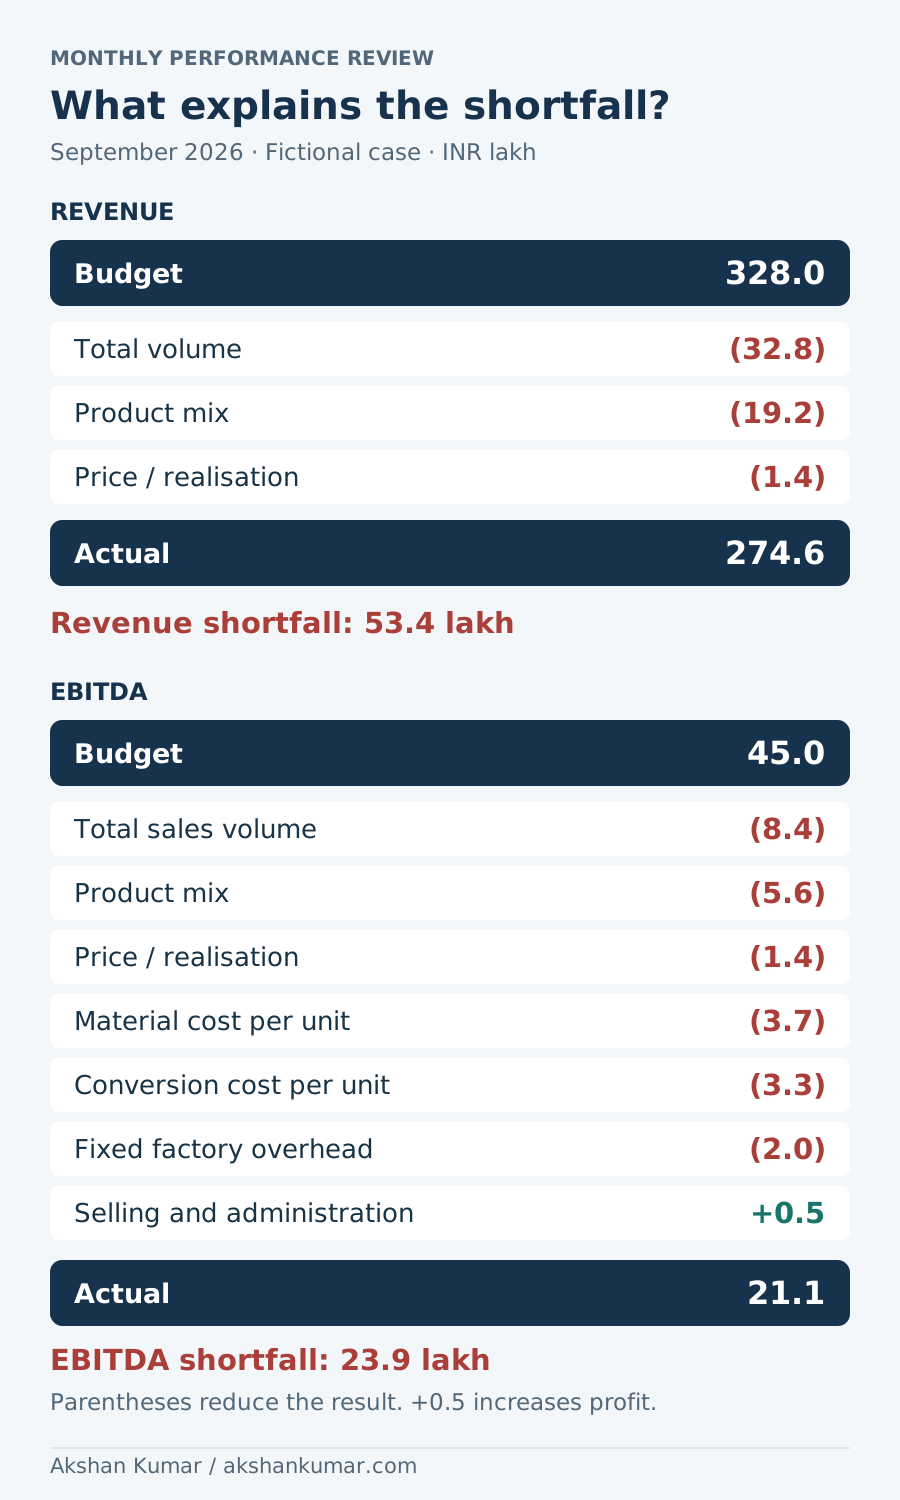
Volume and product mix explain ₹14 lakh of the ₹23.9 lakh EBITDA shortfall. Material and conversion unit costs explain another ₹7 lakh. Those are calculated effects. The underlying causes still need evidence.
Lower total cost does not establish better performance
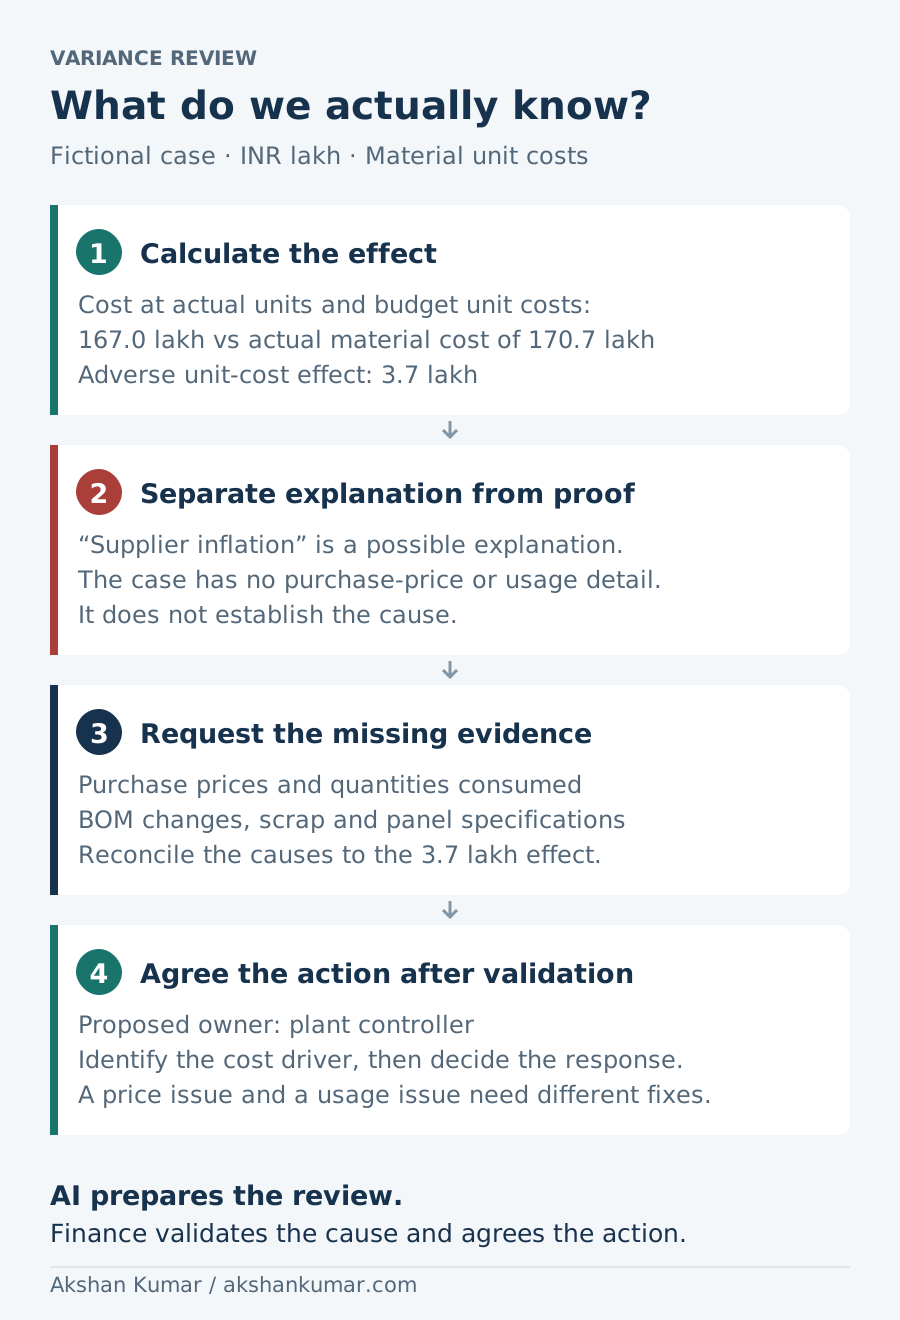
Total material cost is ₹27.3 lakh below budget. But the company sold fewer panels and a different mix. At actual units and budget material costs, spend would have been ₹167 lakh. Actual spend was ₹170.7 lakh, an adverse unit-cost effect of ₹3.7 lakh.
That ₹3.7 lakh could include purchase-price changes, higher usage, scrap or differences in panel specifications. This dataset does not separate them. Calling the whole amount “supplier inflation” would go beyond the evidence.
What the management notes add
Custom-panel sales were 20 against 40 budget. Sales reports 12 planned panels awaiting customer inspection and eight awaiting engineering release. The notes contain no revised delivery confirmation.
A useful review asks which orders were committed for September, what prevented release, whether revenue could have been recognised and what the revised dates are. It does not assume that the shortfall will reverse next month.
Use the pack in four steps
- Validate. Confirm the reporting basis, inspect required inputs and reconcile the source totals.
- Analyse. Trace the volume, mix, price and unit-cost effects through the workbook.
- Challenge. Ask AI to distinguish calculated facts, reported explanations and unresolved questions.
- Draft. Prepare the management commentary and proposed actions, then review the numbers and evidence before sharing.
The prompt pack includes copy-and-paste instructions for each step. Use an approved AI environment that can read the workbook. If it cannot access the formulas, calculated values or source notes, resolve that gap first.
Download the practical pack
Accounting basis and scope
All inputs and management notes are fictional. The workbook is a fixed three-product-family example, with amounts in INR. The guide and infographics use INR lakh.
Contribution is revenue less variable material and conversion attributable to panels sold. Fixed factory overhead is expensed in this simplified management P&L. Fixed overhead and SG&A exclude depreciation and amortisation. EBITDA excludes interest and tax. Inventory absorption and revenue-timing adjustments are not modelled.
Before applying the example to your business, reconcile the accounting basis and source controls. Product-family averages may contain specification and customer mix, so they do not replace SKU, order or production analysis.